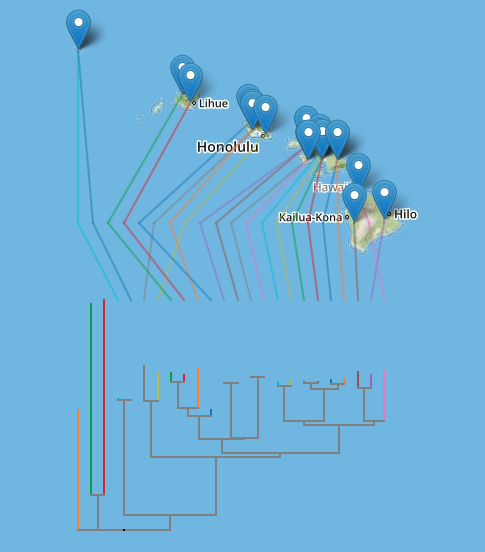
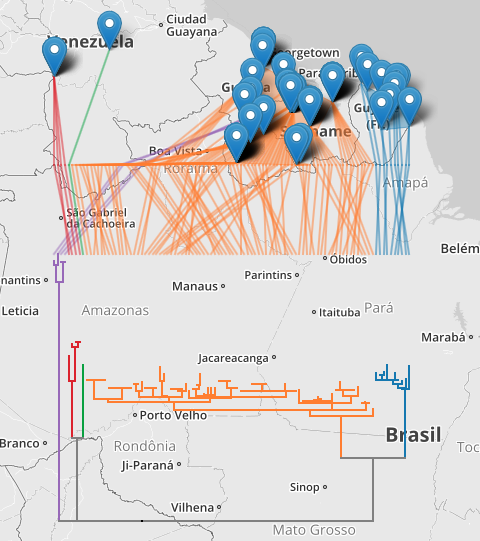
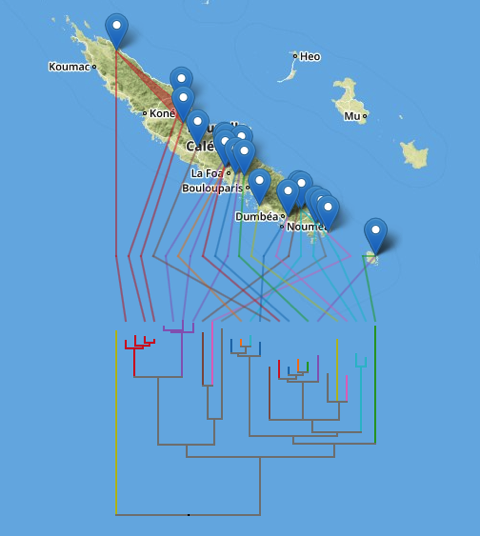
For the last few weeks I've been working on a little project to display phylogenies on web-based maps such as OpenStreetMap and Google Maps. Below I'll sketch out the rationale, but if you're in a hurry you can see a live demo here: http://iphylo.org/~rpage/geojson-phylogeny-demo/, and some examples below.
The first is the well-known example of Banza katydids from doi:10.1016/j.ympev.2006.04.006, which I used in 2007 when playing with Google Earth.

The second example shows DNA barcodes similar to ABFG379-10 for Proechimys guyannensis and its relatives.

Background
People have been putting phylogenies on computer-based maps for a while, but in most cases these have required stand-alone software, such as Google Earth, or GeoJSON for encoding geographic information. Despite the obvious appeal of placing trees in maps, and calls for large-scale geophylogeny databases (e.g., do:10.1093/sysbio/syq043), computerised drawing trees on maps has remained a bit of a niche activity. I think there are several reasons for this:
- Drawing trees on maps needs both a tree and geographic localities for the nodes in the tree. The later are not always readily available, or may be in different databases to the source of phylogenetic data.
- There's no accepted standard for encoding geographic information associated with the leaves in a tree, so everyone pretty much invents their own format.
- To draw the tree we typically need standalone software. This means users have to download software, instead of work on the web (which is where all the data is).
- Geographic formats such as KML (used by Google Earth) are not particularly easy to store and index in databases.
So there are a number of obstacles to making this easy. The increasing availability of geotagged sequences in GenBank (see Guest post: response to "Putting GenBank Data on the Map"), especially DNA barcodes, helps. For the demo I created a simple pipeline to take a DNA barcode, query BOLD for similar sequences, retrieve those, align them, build a neighbour joining tree, annotate the tree with latitude and longitudes, and encode that information in a NEXUS file.
To layout the tree on a map (say OpenStreetMap using Leaflet or Google Maps) I convert the NEXUS file to GeoJSON. There are a couple of problems to solve when doing this.Typically when drawing a phylogeny we compute x and y coordinates for a device such as a computer screen or printer where these coordinates have equal units and are linear in both horizontal and vertical dimensions. In web maps coordinates are expressed in terms of latitude and longitude, and in the widely-used Web Mercator projection the vertical axis (latitude) is non-linear. Furthermore, on a web map the user can zoom in and out, so pixel-based coordinates only make sense with respect to a given zoom level.
To tackle this I compute the layout of the tree in pixels at zoom level 0, when the web map comprises a single "tile".

The tile coordinates are then converted to latitude and longitude, so that they can be placed on the map. The map applications take care of zooming in and out, so the tree scales appropriately. The actual sampling localities are simply markers on the map. Another problem is to reduce the visual clutter that results from criss-crossing lines connecting connecting the tips of the tree and the associated sampling localities. To make the diagram more comprehensible, I adopt the approach used by GenGIS to reorder the nodes in the tree to minimise the crossings (see algorithm in doi:10.7155/jgaa.00088). The tree and the lines connecting it to the localities are encoded as "LineString" objects in the GeoJSON file.
There are a couple of things which could be done with this kind of tool. The first is to add it as a visualisation to a set of phylogenies or occurrence data. For example, imagine my "million barcode map" having the ability to display a geophylogeny for any barcode you click on.
Another use would be to create a geographically indexed database of phylogenies. There are databases such as CouchDB that store JSON as a native format, and it would be fairly straightforward to consume GeoJSON for a geophylogeny, ignore the bits that draw the tree on the map, and index the localities. We could then search for trees in a given region, and render them on a map.
There's still some work to do (I need to make the orientation of the tree optional and there are some edges case that need to be handled), but it's starting to reach the point when it's fun just to explore some examples, such as these microendemic Agnotecous crickets in New Caledonia (data from doi:10.1371/journal.pone.0048047 and GBIF).
